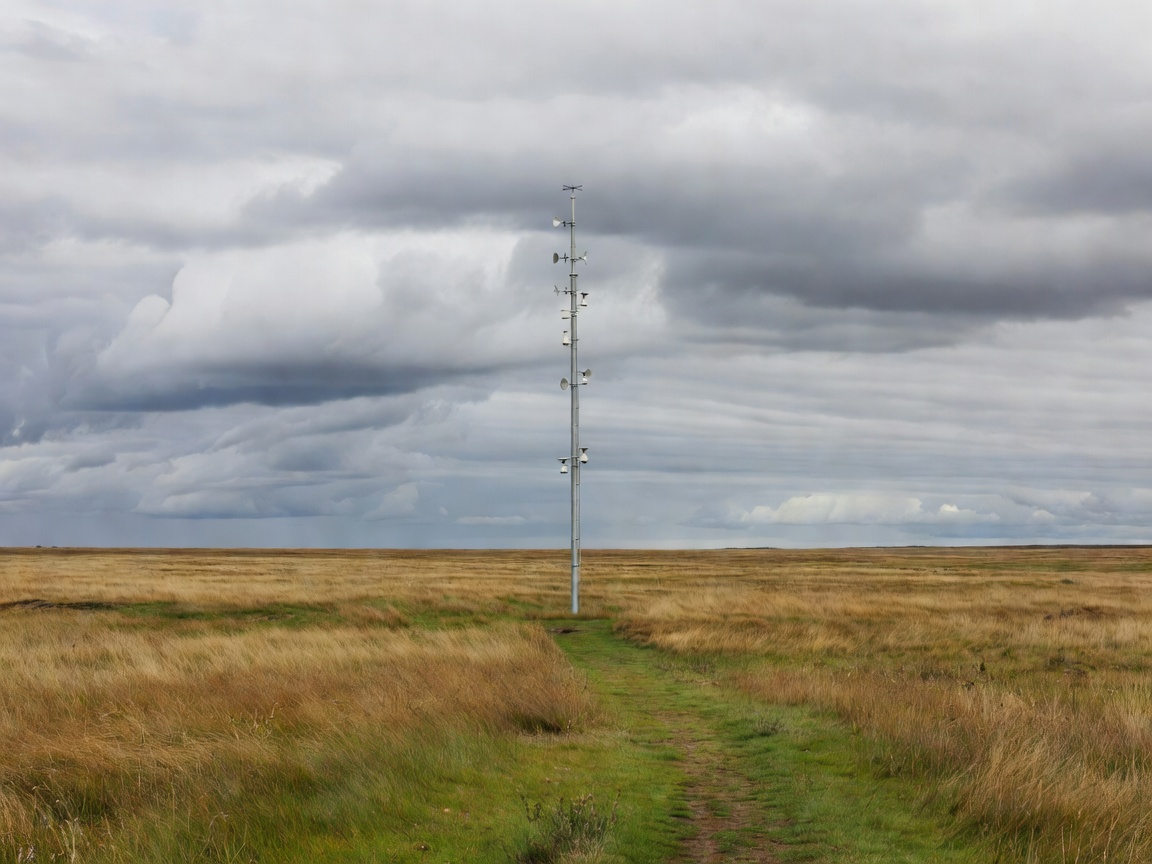
Observing a moving, three-dimensional system
The atmosphere is never measured everywhere at once. Surface stations describe conditions near the ground. Weather balloons sample higher layers. Satellites provide broad coverage, while radar helps reveal precipitation structure and motion. Aircraft and ocean observations add other pieces. Forecasting starts by combining these uneven observations into an estimate of the atmospheric state.
That estimate is called an analysis. Producing it involves data assimilation: a process that weighs observations against a model's prior estimate while accounting for uncertainty. Errors in the starting state matter because small differences can grow. This is one reason a longer-range forecast should not be read as a detailed script for a particular street at a particular minute.
Physical models and AI answer different technical questions
Numerical weather prediction uses equations representing atmospheric processes. A model divides the world into a grid and calculates how conditions evolve. Processes smaller than the grid, such as some cloud behaviour, need approximations. Increasing resolution can reveal more detail but does not remove every uncertainty, and it requires additional computing resources.
AI weather models learn relationships from large datasets, often including reanalysis products that combine past observations with physical modelling. After training, they can generate some forecasts with comparatively low computational cost. That speed can support experimentation or larger collections of forecasts. It should not be confused with a guarantee of better performance for every variable, region or extreme event.
GraphCast, described in Science in 2023, is a prominent research example of machine-learning medium-range weather prediction. ECMWF's Artificial Intelligence Forecasting System provides another important reference for how data-driven forecasting is being developed within a major forecasting centre. These advances matter, but a research benchmark and an operational public warning remain different products with different responsibilities.
Why ensembles are central to warning literacy
An ensemble is a set of forecasts that explores plausible differences in starting conditions or model behaviour. Members may broadly agree on a developing low-pressure system while disagreeing about its track. That spread can help forecasters understand uncertainty. It is not simply noise to be hidden so that one clean map can be shown.
Probabilities also need calibration. Over many comparable situations, events assigned a given probability should occur at roughly the corresponding frequency. A model can rank risky situations reasonably well while giving probabilities that are too confident. Verification therefore examines more than whether the most likely outcome happened on one memorable day.
Rare extremes pose an additional challenge. There may be relatively few relevant examples in a training or test dataset. Performance under ordinary conditions can dominate an average score, concealing weaknesses during the events that matter most for warnings. Independent testing, clear baselines and separate evaluation of extremes make AI claims more informative.
The shorter window needs current observations
For the next few hours, forecasters often place particular emphasis on recent radar, satellite and surface information. This short-range approach is commonly called nowcasting. It can track existing features, but new storm development and rapid intensification remain difficult. Extrapolating a radar image cannot fully describe a storm that has not yet formed.
Warnings also concern impacts rather than meteorological variables alone. The same wind speed may have different consequences depending on exposed infrastructure, ground conditions or the timing of travel. Heavy rain after an already wet period can create a different situation from similar rainfall over a dry catchment. Forecasters and civil authorities interpret those combinations rather than merely copy a model field into a message.
Read the issuer, time and meaning
The Met Office explains its UK warning system through the combination of likelihood and potential impact. Other national services use other categories and procedures. A colour or label taken out of its original system can be misleading. Before acting on a shared screenshot, check the issuing organisation, the affected area, the period of validity and whether a newer version exists.
Forecast disagreement does not automatically mean someone is wrong or concealing information. Products may use different update times, thresholds or geographical scales. A useful comparison aligns those details first. For current protective guidance, return to the official service responsible for your location rather than relying on this educational website or on an isolated model image.
The warning window becomes useful when the forecast connects to an understood decision: reviewing staffing, checking an established plan or following an authorised instruction. Better atmospheric prediction can help, but accessible messages and prepared institutions determine how much of that improvement reaches people.
Sources and further reading
- Lam and colleagues, “Learning skillful medium-range global weather forecasting,” Science, 2023 — GraphCast methods and evaluation.
- ECMWF: Artificial Intelligence Forecasting System — data-driven forecasting documentation.
- ECMWF learning resources — numerical prediction, ensembles and verification.
- Met Office: Weather warnings guide — UK warning interpretation.
- NOAA JetStream — background on observations and weather processes.
Referenced services and researchers are independent of this website.